I live in Roskilde and fish for sea trout, or HØ as we abbreviate it, in the fjord right outside my door and in the neighbouring fjord to the west. Sometimes Nordkysten, the north coast, if the wind is right, and Møn, if I'm feeling really ambitious and the kids are kept busy for long enough. If you've never tried it, picture this: you're standing in waders up to your navel in a fjord in February, casting a lump of metal into grey water. For four hours. Nothing. A blank. Then you drive home, and a mate texts to say he got three silver ones in Isefjorden the same morning. Every angler has a theory about why it goes like that. Mine changes from trip to trip.
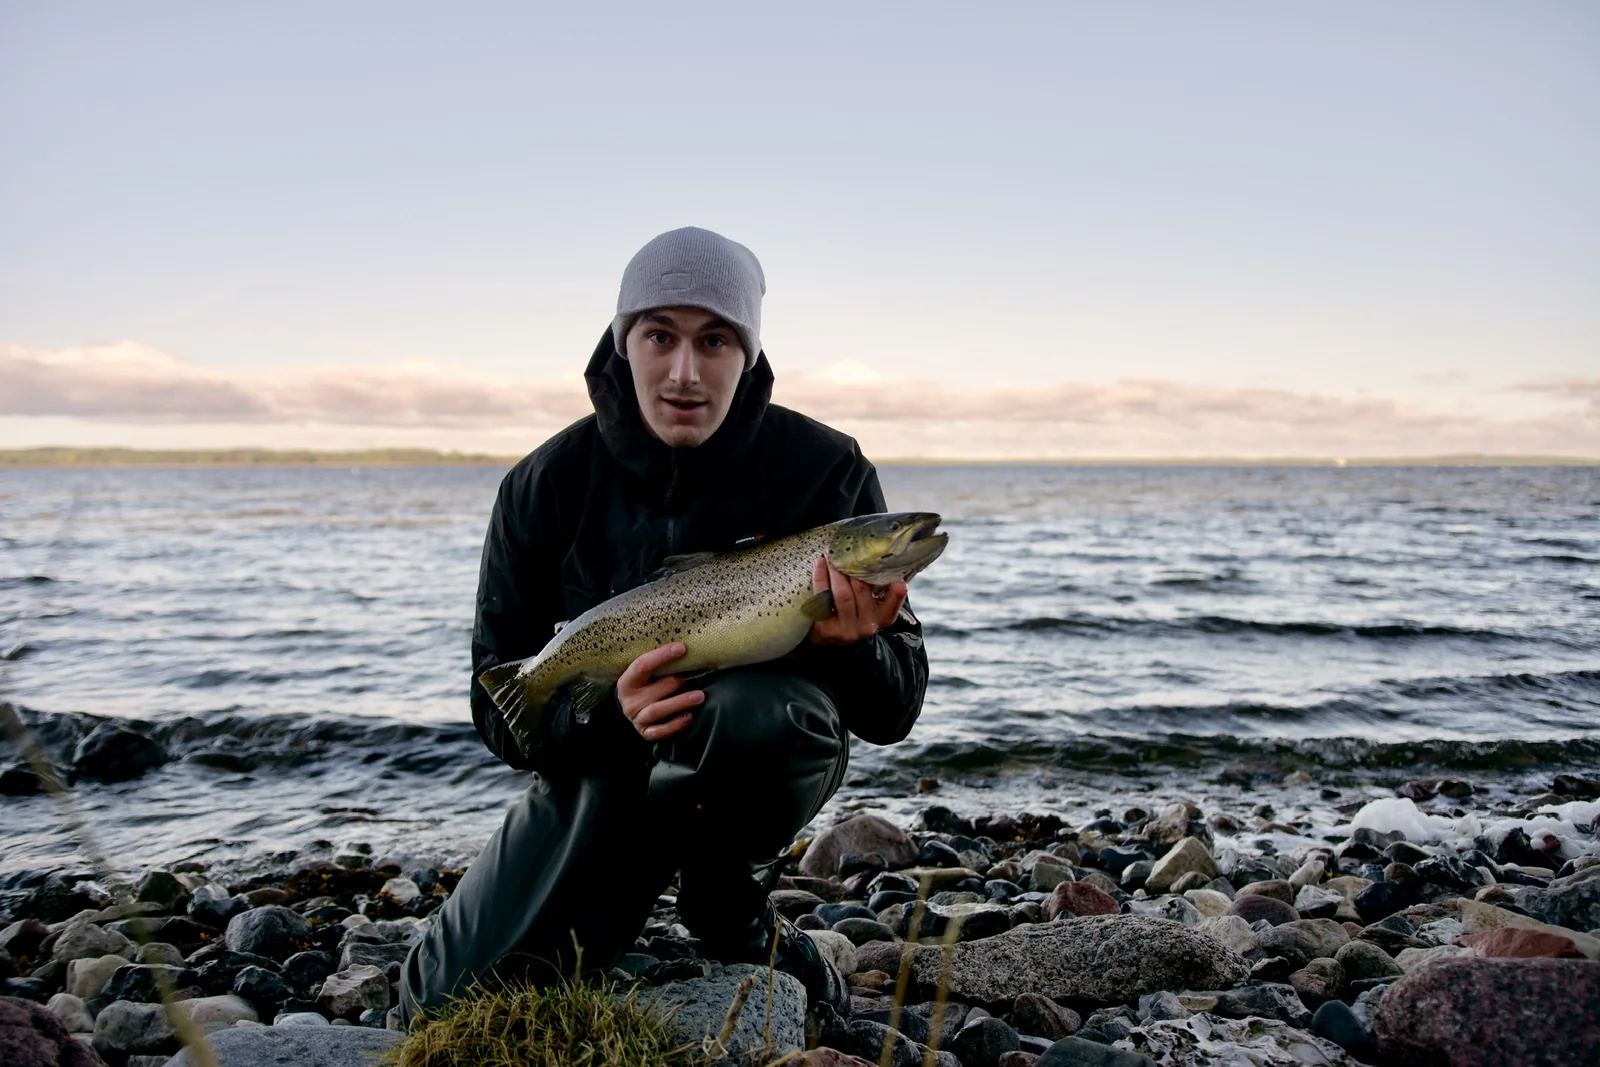
What I actually want to know on a Friday night is pretty simple: where do I go tomorrow morning? Roskilde Fjord north or south, Isefjorden, Nordkysten or Møn? The forecast says north-east, 7 m/s and 1030 hPa. The fishing books say sea trout like "a bit of wind" and "changing conditions". That's probably true. But it doesn't help me when I have to pick one coast. My dad said the same, and he mostly fished for the peace and quiet. None of the books tell me where to stand tomorrow.
Okay, one exception, and it isn't even a book. I'll say it myself before the comments do: Havørredens Hemmeligheder, the secrets of the sea trout. Thomas Hansen's film series, the Danish sea trout bible. Several DVDs, worn to shreds in living rooms from Skagen to Gedser. Until this project it was honestly the best thing I had learned about coastal fishing. And most of what follows is me checking whether the secrets hold up when you hold them against nearly 6,000 catch reports. The fishing books clearly hadn't seen those reports. Or they had, and kept quiet about it.
So I did what you do when you're annoyed and have a Claude subscription: I built something. We, meaning me and Claude Code, started with a RAG. In short, that's a chatbot that looks things up in your own documents before it answers. More on that later. But first we needed data.
Then I found 23 years of reports [data]
A few weeks later I was planning a trip to Bornholm and ended up on the local angling club's website. The design hasn't been touched since Nokia made phones. But behind it there's a page called din fangst, your catch, where the members have written in every single fish worth bragging about, all the way back to 2003. Date, place, species, weight, bait, time of day, a photo and a few lines about the trip. It's a bit funny that the best data on Danish sea trout lives on an island 150 km out in the Baltic. But Bornholm has always taken its fishing more seriously than the rest of us. Here's a report, roughly as it looks on the site:
{
  "dato": "30 July 2026",
  "art": "Carp",
  "sted": "Præstemosen",
  "tidspunkt": "9.30 pm",
  "agn": "Sweetcorn",
  "kommentar": "Enjoying the summer holidays with lots of fishing trips with dad, and I
    finally managed to get some carp. The biggest was taken at 9.30 pm and the
    others around 6 pm. So a really lovely trip to Præstemosen."
}
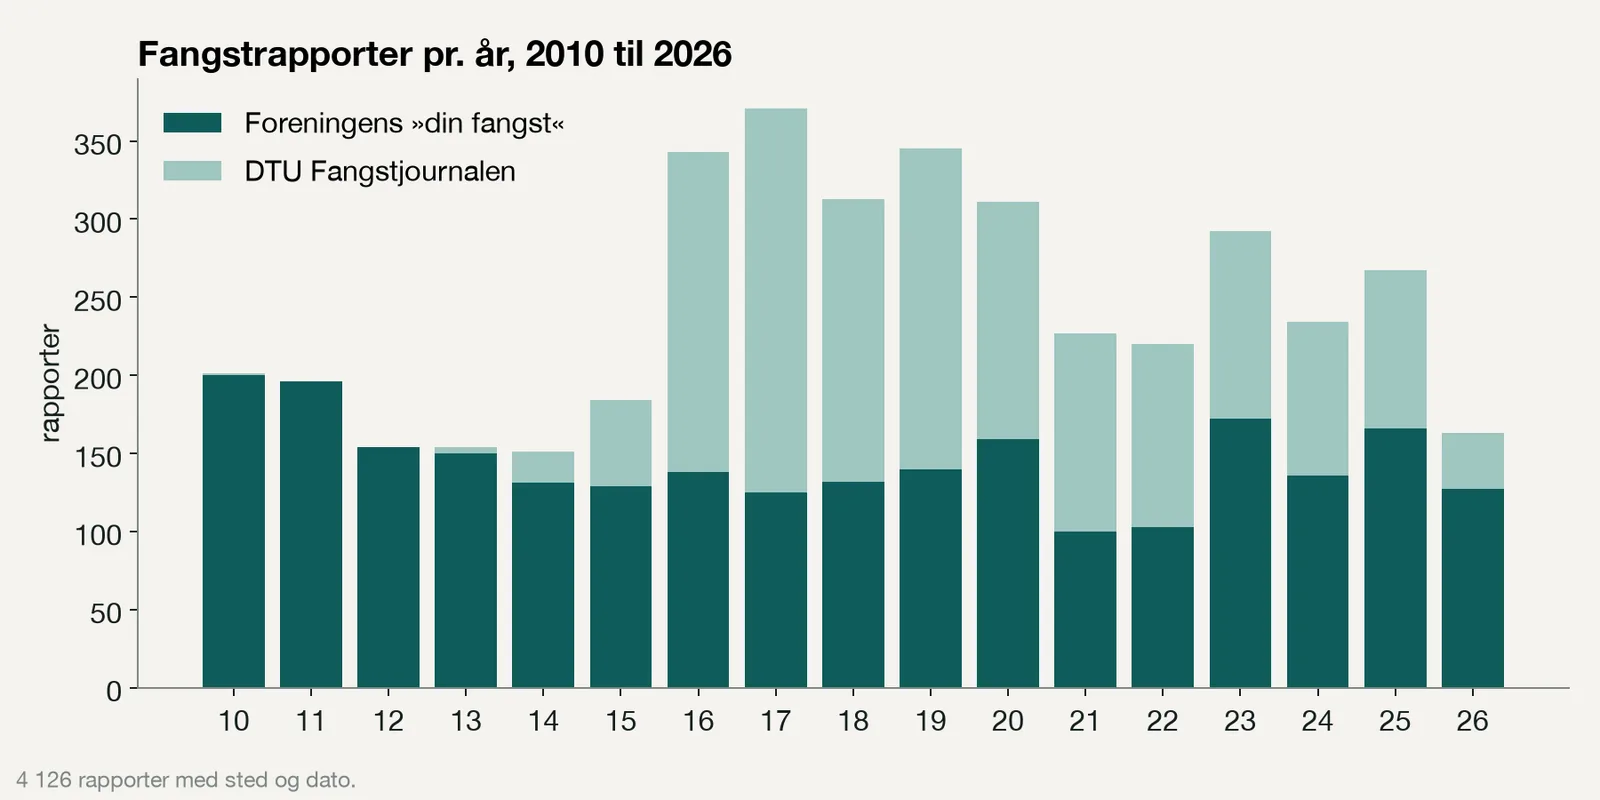
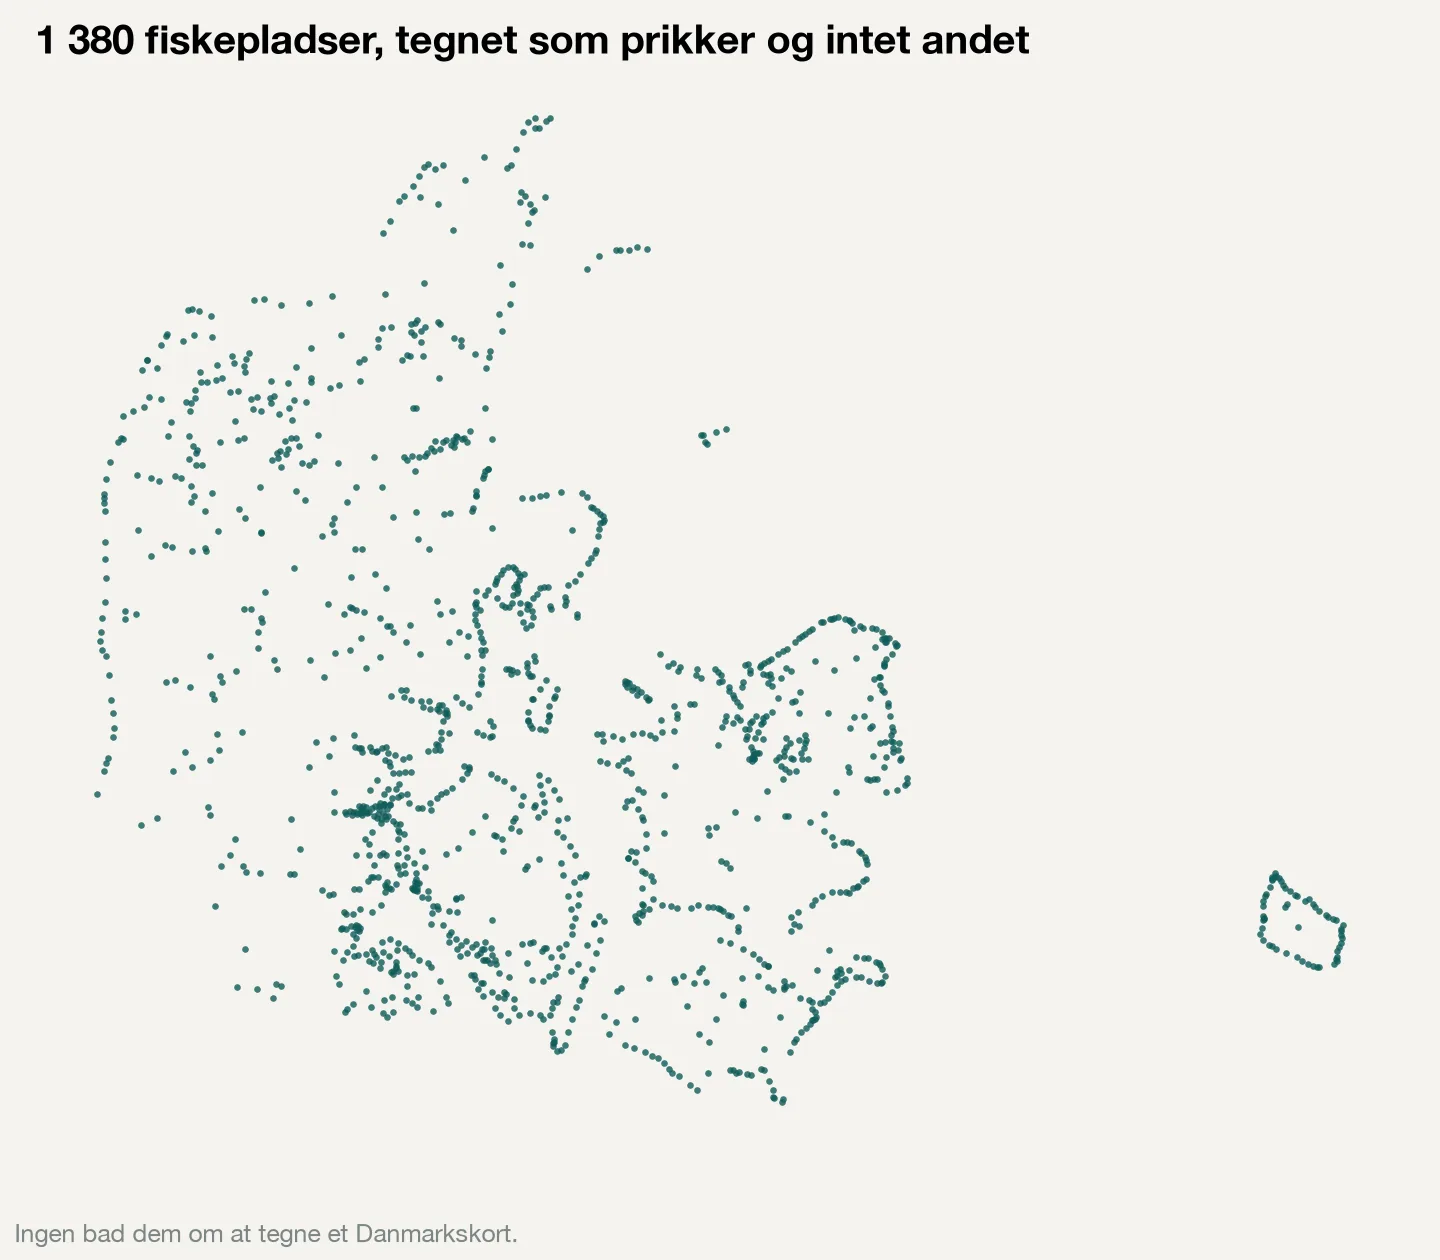
That's a kid, his dad, a tin of sweetcorn and a timestamp. And there are 3,920 of those. Then DTU Aqua, the national fisheries institute, has something called Fangstjournalen, their catch journal, with 2,000 more. They're filled in as thoroughly as a tax return, condition factor and all. And then there's a third site that describes 1,380 fishing spots with coordinates and which way the coast faces.
I sat reading the club's site for a whole evening instead of going to bed. One of them wrote that the garfish had arrived "6 days later than last year". Which means somebody over there is timing the garfish. Another had hooked up sixteen times in three hours. Six landed, three released, three taken home, the weight noted to the nearest hundred grams, and then a sentence about the colour of the water. These people were actually doing science. They just called it a trip to the coast.
So the question asked itself. What if I pulled it all down, linked every catch to the weather that day at that place, and then checked the old advice? Does the barometer matter? Does onshore wind help, or do you just get wet? These sayings have survived for a hundred years because nobody has had enough data to argue with them. I had no scientific method and no research degree. But I had my MacBook, Claude Code, the internet and a free weekend.
It ended up being seven steps. And every single one of them broke in its own way. That's actually the fun part.
- The crawler that dropped half the fish without saying a word
- The chatbot said yes to everything
- There is no API for local dialect
- Eleven minutes to the weather quota
- A dataset that only contains good news
- The comments were the data all along
- The three-day rule, tested
The crawler that dropped half the fish without saying a word [step 01]
There were no APIs, of course, meaning no tidy way to get the data out. So it became Node and Playwright, one scraper per site, written over a couple of evenings. Claude Code was at the keyboard, and I handled the swearing. The club's site is 23 years of HTML, made by four volunteers with four different opinions about the <strong> tag. The date is in bold, except in 2026, when it moved. The weight is written as "2,6" or "2.6 kg" or, once, "about two and a half".
Fangstjournalen was the opposite. Tidy rows, but a pager that swaps the rows out in place without changing the address in the browser. So the first version of the scraper read page one twice, concluded that the internet had ended, and stopped after fourteen fish.
But that wasn't the real problem. The real problem was deduplication. That is: a scraper runs more than once, so you need a key that can say "I've seen this report before", so you don't save it twice. Our key was too loose. It thought far too many reports looked alike, and quietly threw half the club's reports away as duplicates. No error, no crash. The numbers were just a bit low, the way a bank account can be a bit low. I only noticed when I counted one year by hand and held it up against the site. Then we rebuilt the parser and ran the whole thing again from scratch. The club's dataset went from 1,562 to 3,920 catches overnight. Half the fish had been there the whole time.
[fig 03] This is where the fish were hiding
If you're a developer and only remember one thing from this, make it this: a scraper that runs without errors is not the same as a scraper that works. Count your rows against the source. Like a suspicious fishmonger.
The chatbot said yes to everything [step 02]
The data we had pulled went into Postgres on Supabase. And then I did what everyone did in 2024: I put all the reports in a vector database and let a chatbot answer from them. That's what's called a RAG. The idea is that when you ask a question, it finds the reports that most resemble your question and hands them to the language model, so it can answer from real data instead of guessing. It felt like magic. I asked "what do people catch at Salene in March?", and it answered with real catches, bait and weights.
Then I asked the question I actually wanted answered: do sea trout bite better when the barometer is falling? It said yes and found five reports that mentioned falling pressure and a fish. But that proves nothing. People only write reports when they catch something. Nobody writes "A blank, though the pressure was lovely". A RAG finds the texts that resemble your question. It doesn't count how often something is actually true. So you ask about falling pressure, it finds falling pressure, and the language model on top says yes. It says yes to anything you ask about, as long as it's written down somewhere.
The chatbot got to stay on as a friendly front page. But the answer to my question had to be found somewhere else. I needed to count instead of search.
There is no API for local dialect [step 03]
To link a catch to the weather you need coordinates. And anglers don't write coordinates. They write "Sydkysten", the south coast. They write "off Nørrekås". One of them just wrote the name of a road that runs past a lake. 935 different place names in all, and some of them were quite clearly made up to keep the spot secret from exactly the kind of person who builds a database. Me, in other words.
The easy ones we handled with fuzzy matching against the 1,380 known spots, meaning looking for names that roughly resemble each other. The ordinary ones went to OpenStreetMap's geocoder, which looks up a place name and hands back coordinates, one polite call per second. The rest was me, a text editor and local knowledge:
ALIASES = {
    "sydkysten":    dict(lat=55.00, lon=14.95, coast="S", name="Bornholms sydkyst"),
    "vest":         dict(lat=55.12, lon=14.70, coast="W", name="Bornholms vestkyst"),
    "lufthavnen":   dict(lat=55.06, lon=14.75, coast="E", name="Stenkysten under Rønne Lufthavn"),
    "ud for rønne": dict(lat=55.09, lon=14.66, coast="W", name="Ud for Rønne", type="båd"),
}
Forty lines like those cover a third of the club's reports. In the end, 87 percent of the catches had a point on the map. The rest were Norwegian rivers, private lakes and "a secret spot", and those we left alone. With respect. The last part of any geocoding job is always a human who knows that when a Bornholmer says "Lufthavnen", the airport, he means the stony reef under the approach path and not a terminal. Remember to budget for that human.
Eleven minutes to the weather quota [step 04]
Then there was the weather. For every catch I wanted the weather that day at that place. And for the model I also needed the weather on all the days when nobody caught anything, which is most days. That comes to roughly a million place-days since 2010. It also means the model only gets the 4,000-odd catches from 2010 onwards. Before that there simply isn't enough weather data.
Open-Meteo has a historical weather archive that is really good and free. So I pointed the script at it and went to make coffee. The problem is that they count by how much data you pull, roughly one call per two weeks of history per place. And the sums looked like this:
16 years × 258 grid cells × 26 fortnights ≈ 107,000 calls
free quota: 10,000 a day
first 429: after 11 cells, before the coffee was ready
We sat quietly for a bit, as we usually do when that sort of thing happens. Then plan B: weather stations. Meteostat has DMI's stations hour by hour, and they don't care how far back you ask. So we pulled 33 Danish stations back to 2010, rolled the hours up into daily values and gave each catch its nearest station. In the end fifteen stations did all the work, like fifteen very patient meteorologists. Out of that we got all the things anglers stand around arguing about in the car park while pulling on their waders: wind strength, whether the wind is onshore or offshore, pressure and how it has moved over the last 24 and 72 hours, whether the temperature is on its way up or down, cloud cover and how many hours of daylight.
So now it works like this: the history comes from the stations, tomorrow from the forecast API, and the whole thing is held together by a cron job and a healthy dose of optimism. It runs every night and has actually only gone down on the nights when I was fiddling with something myself.

A dataset that only contains good news [step 05]
Here's the trap I walked straight into with the model. Catch data only contains the days when somebody got fish. There's no form for "stood in the water for four hours and watched the fjord's black pirate, the cormorant, take three right in front of my nose". So you can't teach a model the difference between a catch and a blank, because the blanks simply aren't there. Ecologists run into exactly the same wall with species observations, and they call it presence-only data. Which, incidentally, is also a pretty accurate description of my own fishing diary.
Their trick is simple, so we stole it. For each place you draw fifteen random days from the same years, days where we don't know whether anything was caught. Then you teach a model to tell the catch days from the random days, using only the weather. It's also told the season, the weekday and the place, so it can't cheat by just learning that Danes fish in March and at the weekend. What's left is, roughly, the weather. The model itself is a gradient-boosted model from scikit-learn, and it trains in about the time it takes to tie a leader knot.
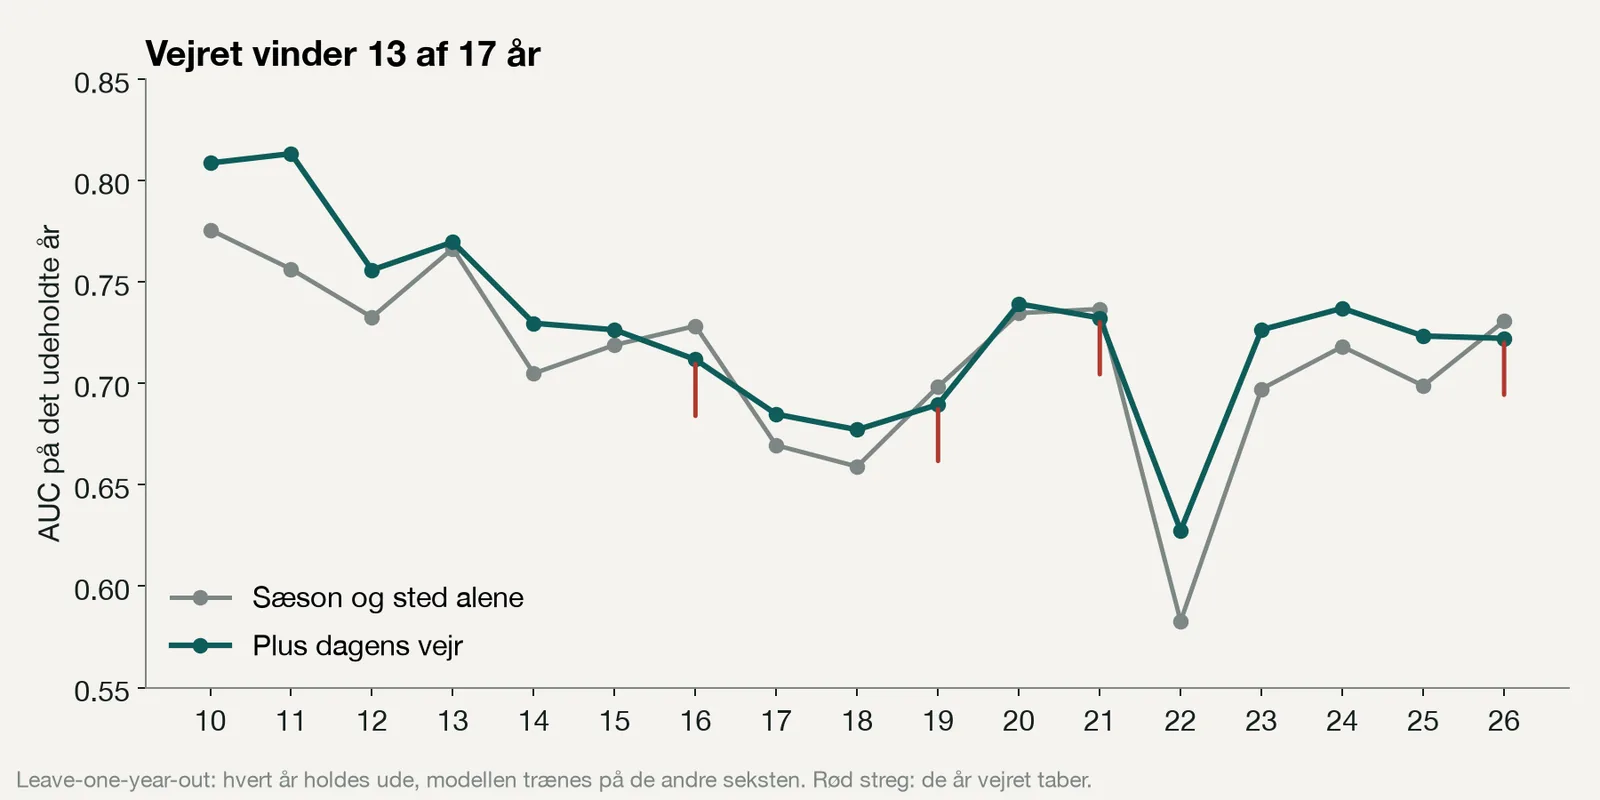
The part I'm actually proudest of is the boring part: the way we test. We take a whole year out, train the model on the other sixteen years and then let it guess at the year it hasn't seen. And then we do that for all seventeen years, one at a time. It's called leave-one-year-out, and the point is that the model doesn't get to memorise the answers. It has to guess at a year it has never seen. And we always train two models, one without weather and one with. Because that's the only way to see what the weather actually adds. On the first dataset, the one that was half broken, the answer was: nothing. The model with weather was actually a touch worse. I sat staring at that for a while. On the clean data it's a small but stable lift. And that lift is the only number that really matters.
Out of that comes a number from 0 to 100 for every spot, every day. We call it the bite index. 80 means the day looks better than 80 percent of all days for that species. And it comes with reasons, because a number without a reason is just a weather forecast with attitude. Here's what it said one Monday in October, best and worst spot in the country:
Kragesand        90   wind 88° 5 m/s onshore, 1034 hPa rising, 9.7°, overcast
                      + very high pressure (x1.6)  + overcast (x1.3)  + cool 5–10° (x1.3)
Saltuna          18   wind 68° 9 m/s along the coast, 1035 hPa, 11.6°
                      − fresh to strong wind (x0.6)  − mild 10–15° (x0.7)
And here it is today. This isn't a picture. It's the model's answer for the next seven days around Roskilde, saved the morning this page went up. Tap a day, a species or a spot.
The numbers in brackets are what's called lift. It's just this: how much more often do we see this weather condition on catch days than on perfectly ordinary days? Very high pressure 1.6 means it shows up 60 percent more often when something gets caught. Below 1 means it's rarer. That's the half of the model you can explain. And it's the reason an angler can argue with the number instead of just shaking their head. Here's the whole sea trout table. Pick a weather factor.

Falling barometer: 0.90. That's the myth the chatbot said yes to. Wind above 8 m/s: 0.6, and a gale 0.43. Cold: 1.65. We'll come back to all of it at the end.
There's one weakness I still can't model my way out of. We can't separate "the fish were biting" from "people went to the coast". A gale empties the coast of anglers whether the fish are feeding or not. So when there are few catches in windy weather, we don't know whether it was the fish or the anglers that stayed home. The solution turned up in the last place I looked. Which was also the first place I should have looked.
The comments were the data all along [step 06]
2,203 of the reports have a free-text comment. And the comments hold everything the form forgot to ask about. Take this one from Bornholm's east coast, April 2010:
"Lovely day with sunshine. Had bites on the first four casts and only on the fourth did the fish make it into the net. The others were all silver. Lost seven fish in total, they jumped and twisted themselves free again and again. Released two that had turned silver again but still lacked a bit of body before they come home for the pot! So a glorious fishing trip of a couple of hours!"
It says how many hours were fished, how many fish were lost, whether they were silver or coloured, and that two were released. Written by someone who was standing in the water. So we gave a small, cheap language model a JSON schema with twenty fields, meaning a fixed list of the things we wanted out of every comment. And one strict rule: if it isn't in the text, answer null. In other words, it's not allowed to guess. Thirty comments at a time. The paragraph above came back as:
{
  "fish_hooked": 10,
  "fish_landed": 3,
  "fish_lost": 7,
  "hours_fished": 2.0,
  "fish_colour": "blank",
  "weather_note": "solskin",
  "trip_outcome": "good"
}
150 comments cost $0.08. That's less than the spoon I left in the weed the same evening. The whole pile later cost under a dollar. On those trips fish were hooked 428 times, and 374 of them were landed. Nobody has ever had a landing rate for Danish coastal fishing. Now there is one. It's 87. And the other 13 percent are the ones you'll hear about in the car on the way home.
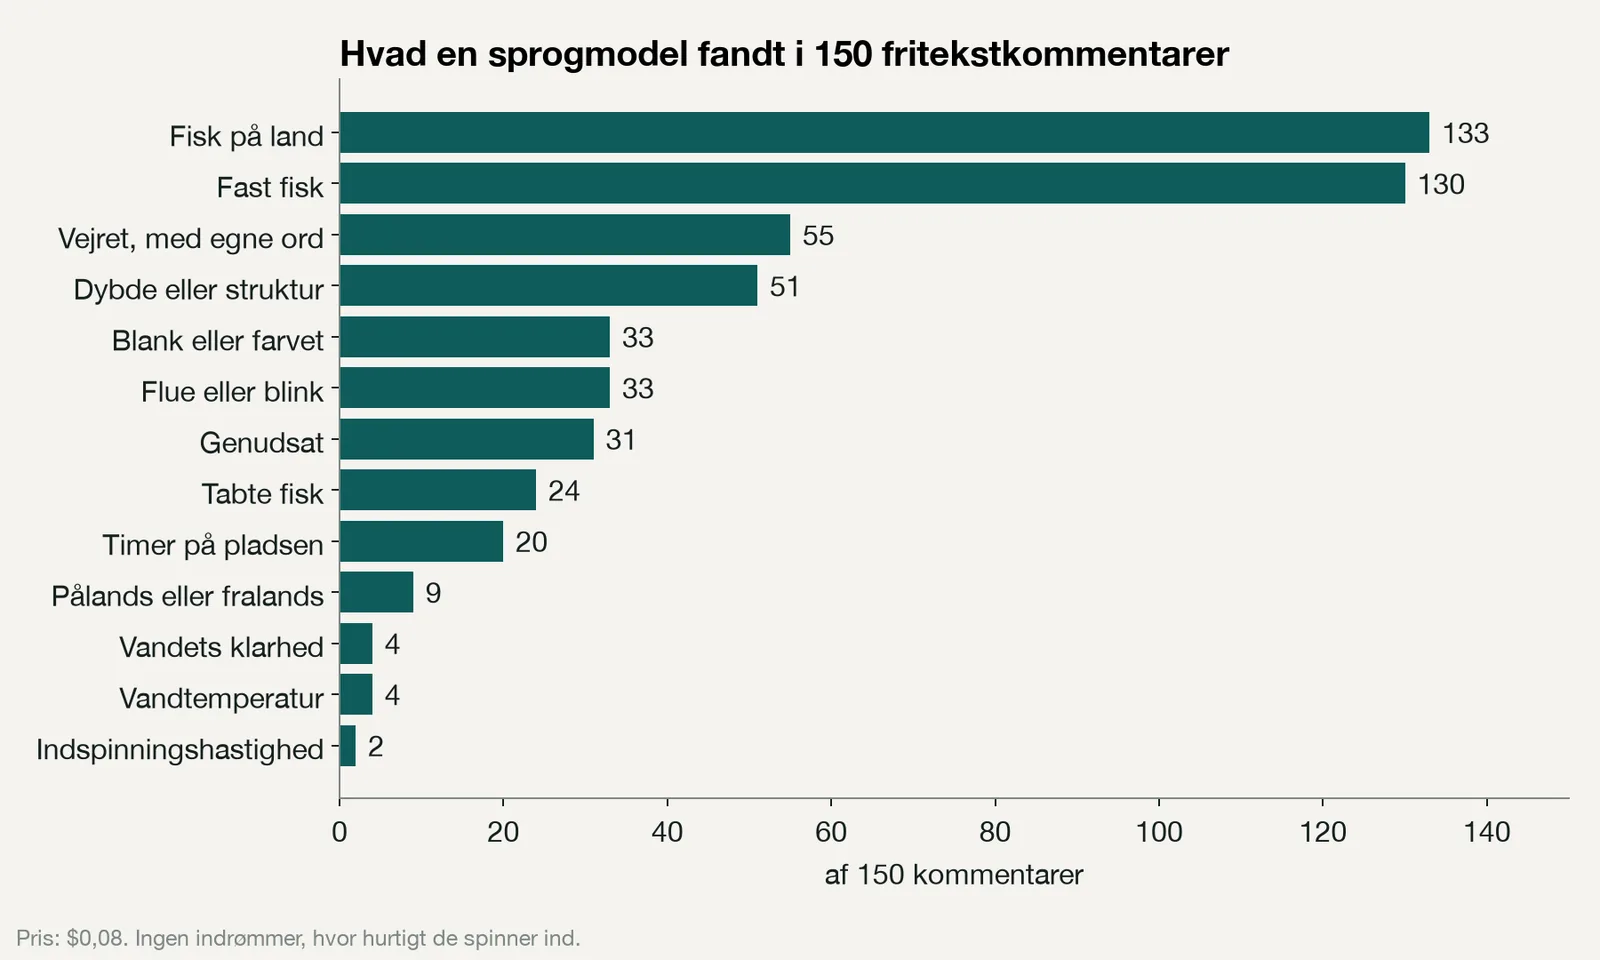
So the most valuable column in the whole project was a text column. And the price of reading it has dropped from "a student assistant for a whole summer" to "a cup of coffee". That's really what I take away from this. More than anything about fish.
The three-day rule, tested [step 07]
All the seasoned coastal anglers I know look at the wind over the last three or four days before deciding which coast to stand on. The logic is that three days of westerly wind pushes water, colour and food onto the east side of the fjord, while the west side goes low and clear. It's the advice you hear most often around Roskilde, and it had been on our list of things to test from day one. The first model deliberately knew nothing about it. It got yesterday's pressure and the week's temperature, but of the wind it only got today's. We wanted a clean baseline first, a starting point to compare against, before feeding it the folklore.
Then we taught it. Six new features, meaning six new things the model gets told, all computed over the three days before the catch day: how hard and how steadily the wind had blown onto that particular coast, whether it had turned, the strongest gust, and how many days since it last blew properly. The station data had all of it already, back to 2010. And then the same test as always: hold each year out, train on the rest, compare with and without.
                      season+place   +today's weather   +3 days of wind
AUC, 17 years           0.712          0.728              0.724
catches in top 20%      41%            44%                44%
The data shrugged. Nationally, the three-day rule gives nothing you can measure. We sat quietly for a bit again, as we usually do, and then looked in the lift tables. And that's where it got interesting:
Bornholm, open Baltic coast
  3 days of strong onshore wind       x1.20
  1–2 days after a blow               x1.14
  blowing today                       x0.53
Jutland and Funen, mostly fjords and belts
  3 days of onshore wind              x0.81
  3 days of offshore wind             x1.19
Spots with "fjord" or "vig" in the name (small sample)
  3 days of offshore wind             x1.31
So the rule holds. It just points in opposite directions depending on where you're standing. On Bornholm's stony coast, three days of onshore wind stirs up the bottom, and the fish move in to eat whatever gets churned loose. In a fjord, three days of onshore wind means murky, washed-in water on your side, so the fish are over on the other, calmer shore, where the water is clearing up again. Add it up across the whole country and the two cancel out. And that's exactly what the model reported back. It wasn't wrong. It just gave a national answer to a local question.
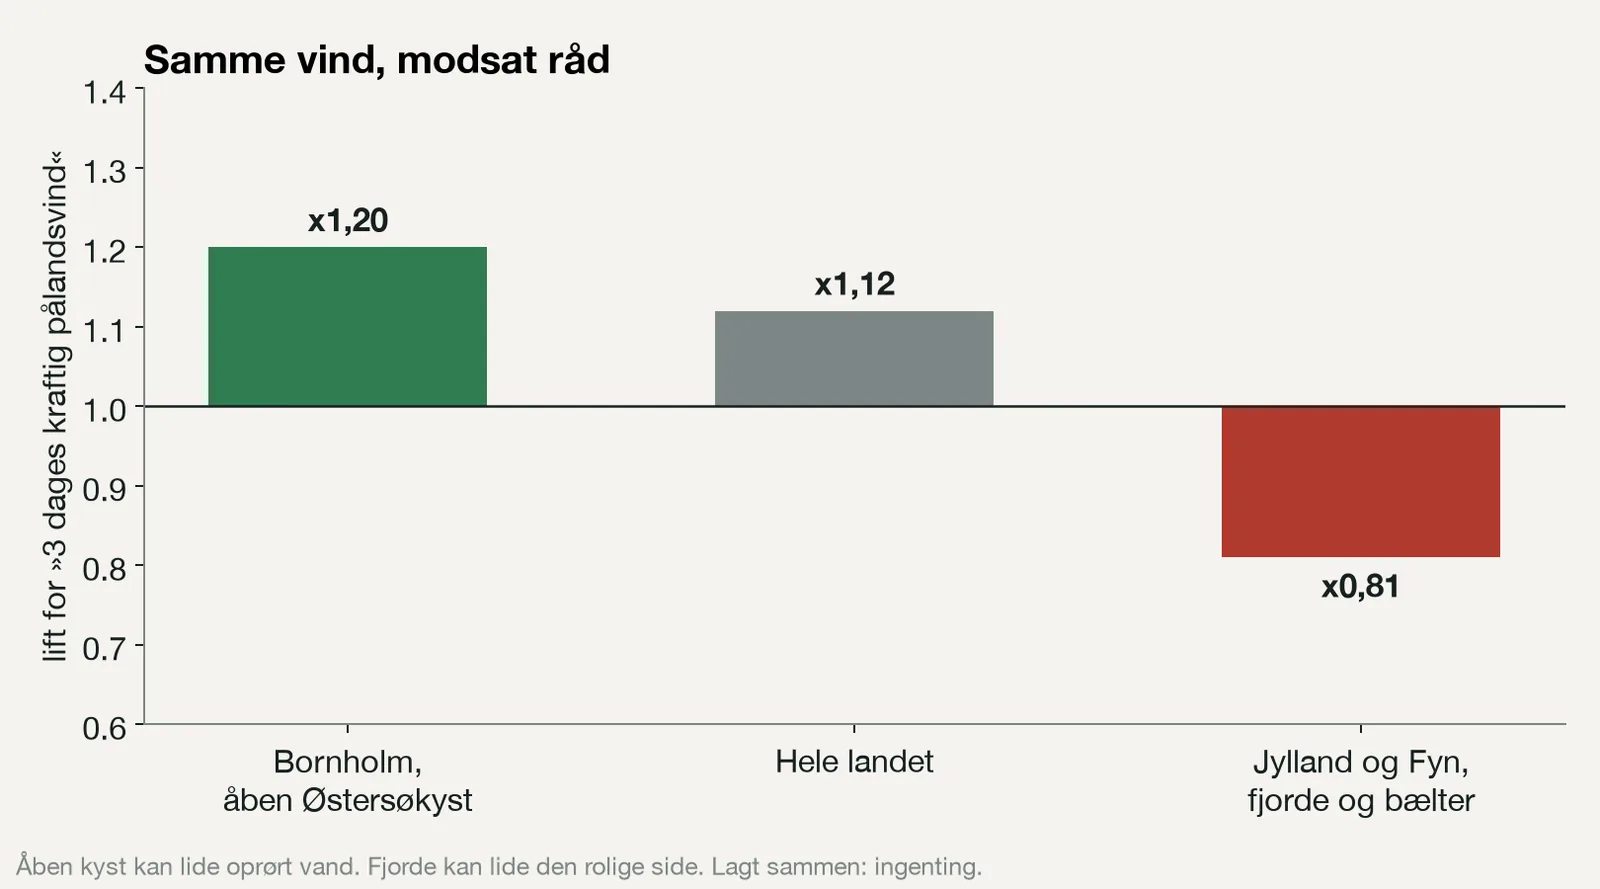
We kept the new features anyway. The explanations got better, even where the score didn't. "Three days of onshore wind" is a sentence an angler can relate to. In the next version the model gets to learn the rule per coast type, and we're going after DMI's water level gauges, so it can see the water move instead of guessing it from the wind. Roskilde has one of those gauges. Of course it does.
What the data says, so far [results]
- The falling barometer is a myth, at least in Denmark. Rising pressure gives 1.1, falling 0.9, and very high, stable pressure 1.6. The books were wrong, and the chatbot had learned it from them.
- Above 8 m/s the wind is the whole story. Below that it means almost nothing.
- The three-day rule is true, but it cancels itself out: onshore wind is good on Bornholm's open coast (1.2) and bad in the fjords (0.8). Ask the data a local question, or all you get is a national shrug.
- Cold is good. Air at 0–5 °C lifts the odds 1.65 times. Above 20 °C they drop to 0.3. So the fish and the angler don't agree on what a good day is.
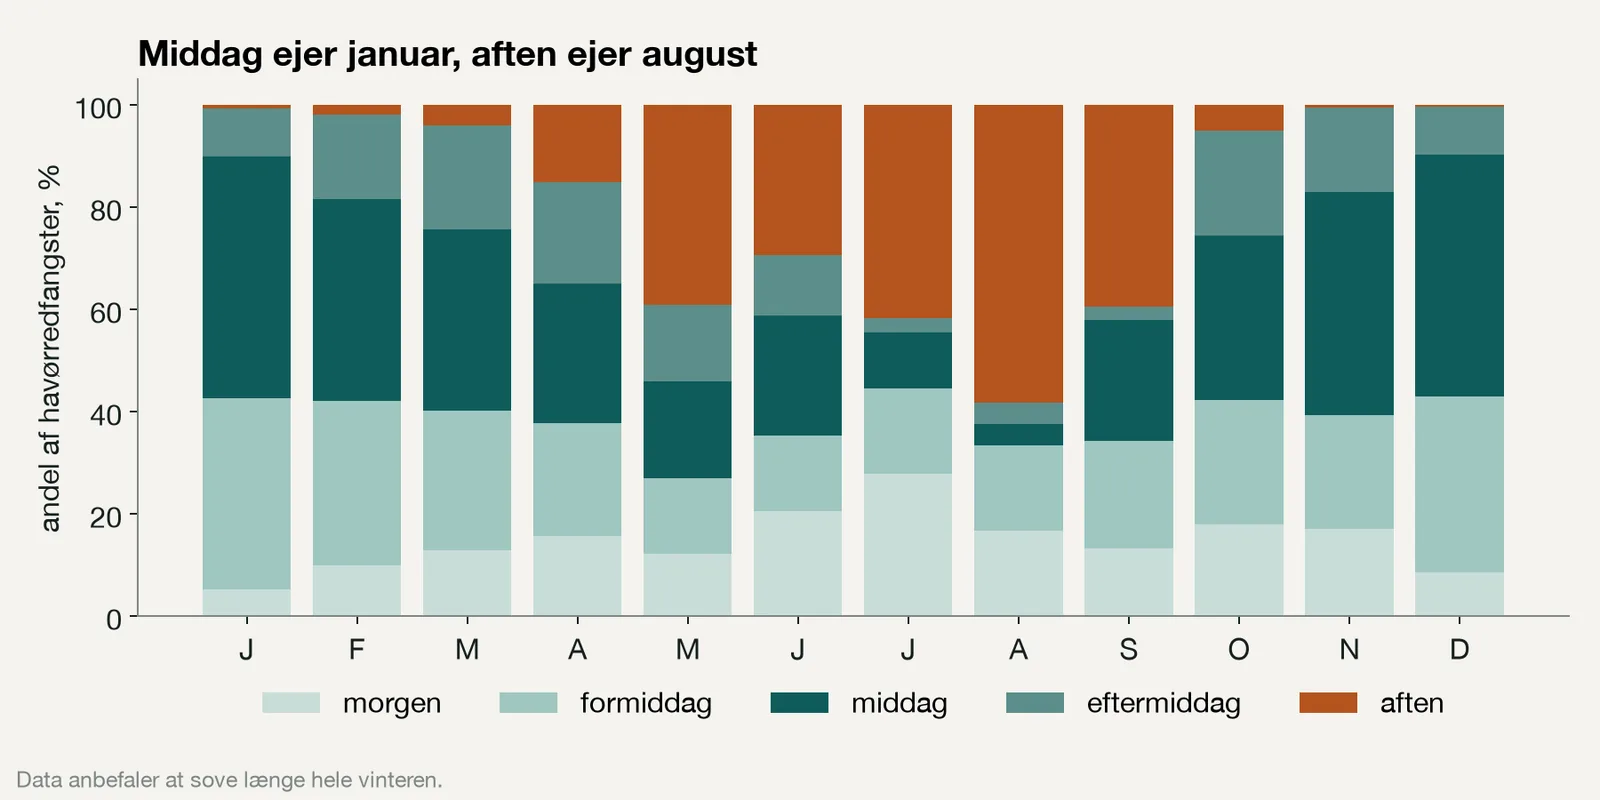
- The time of day flips with the season. Midday owns January, evening owns August. So the data recommends sleeping in all winter.
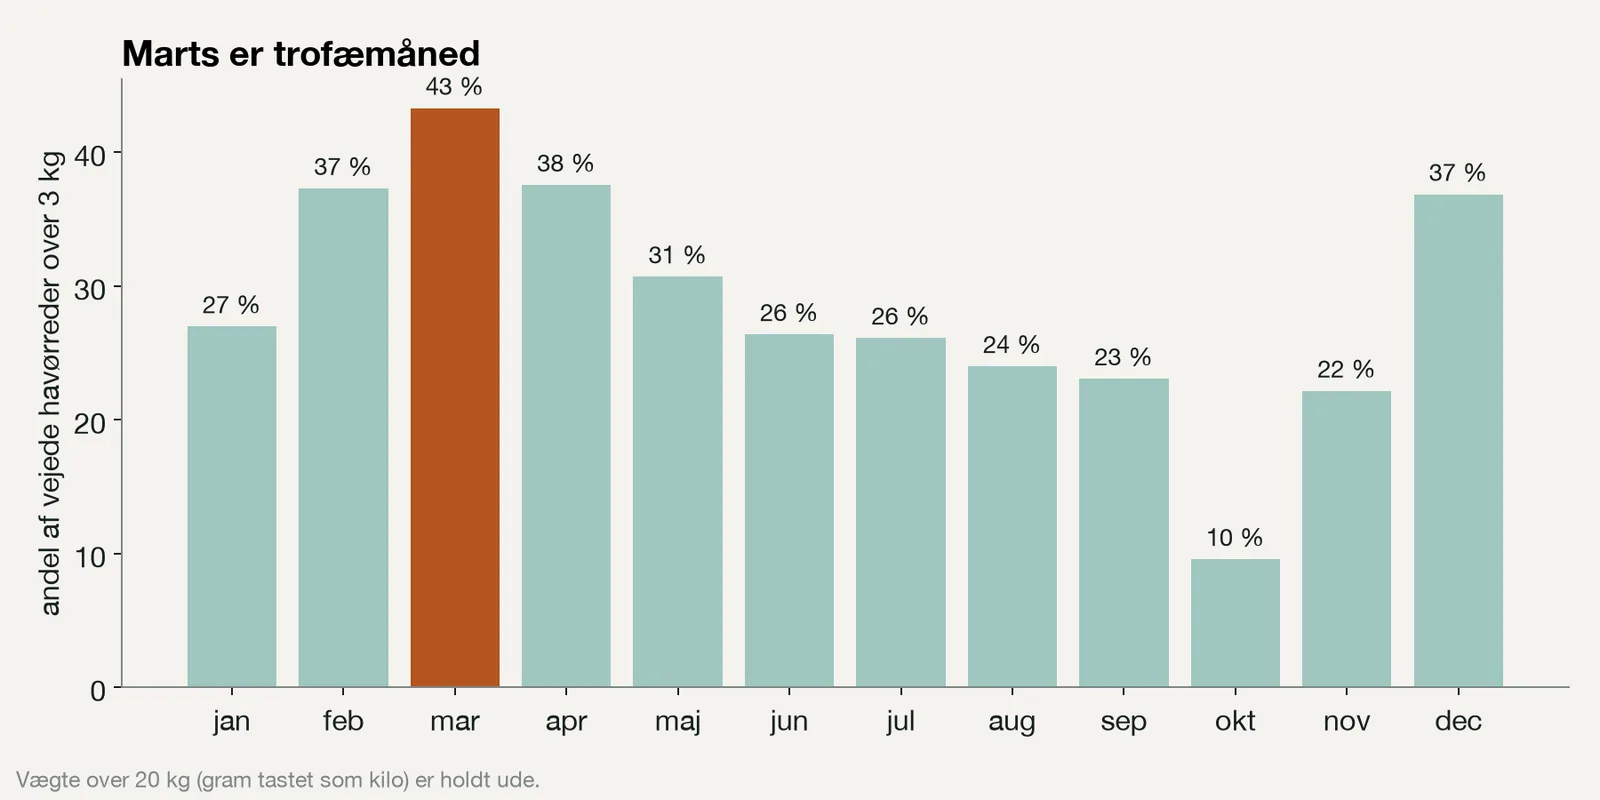
- March is trophy month, 43 percent of the weighed sea trout are over 3 kg. April and May are skinny-fish months. Put them back.
- Season and place alone give an AUC of 0.712. With weather: 0.728. AUC is a measure of how good the model is at telling good days from bad, where 0.5 is pure guessing and 1 is perfect. The best 20 percent of days hold 44 percent of the catches. It's modest, it's honest, and it's better than the book.
What now [app · mcp]
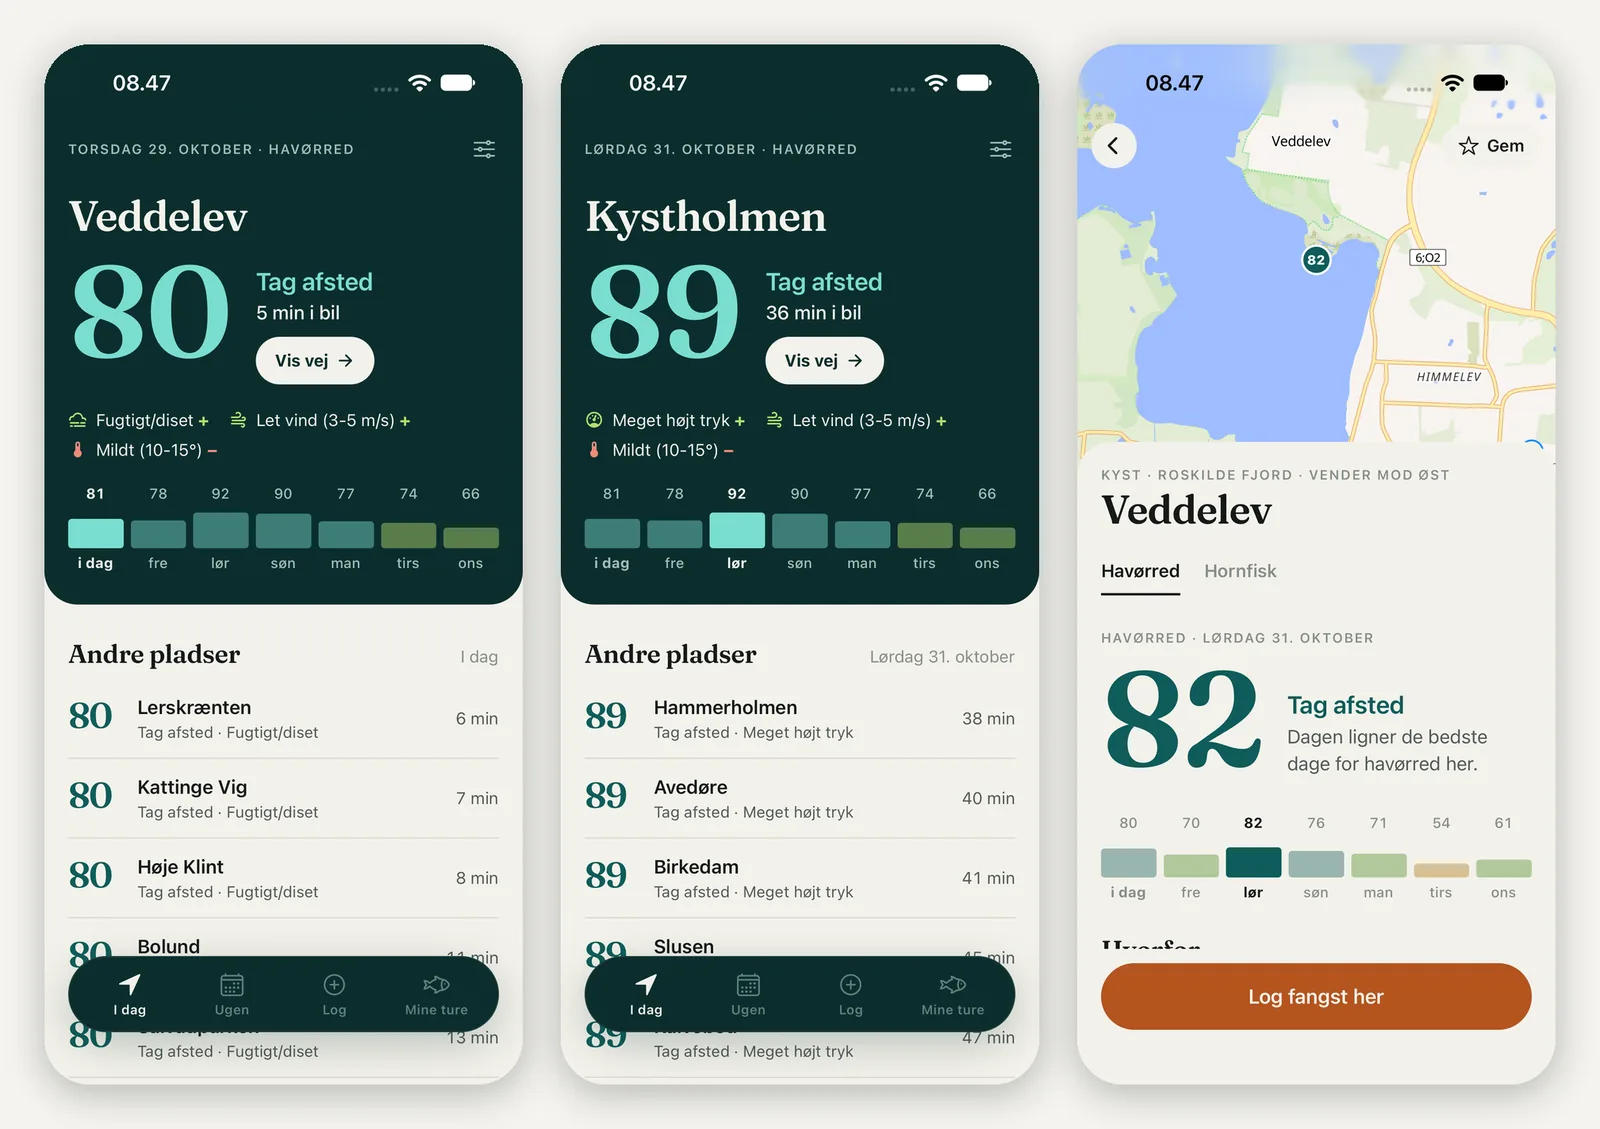
The next step is a model that knows how many people were actually on the coast, built on what the comments told us. Then weather at the hour of the catch instead of the whole day, because sea trout feed at dawn and dusk, and the club's reports actually have a time of day. And then an app that answers the Friday question with one spot, one number and a driving time, with the reasons underneath, so an angler can see why Tuesday is an 80 and complain about it. The app already runs in the simulator. In my experience that's 80 percent of the work and 20 percent of the way.
And because the whole catalogue also lives as an MCP server, meaning a small server Claude can call up and ask questions, you can ask Claude the same question and get the same answer. Just with more words. This is what it looks like when Claude Code asks it:
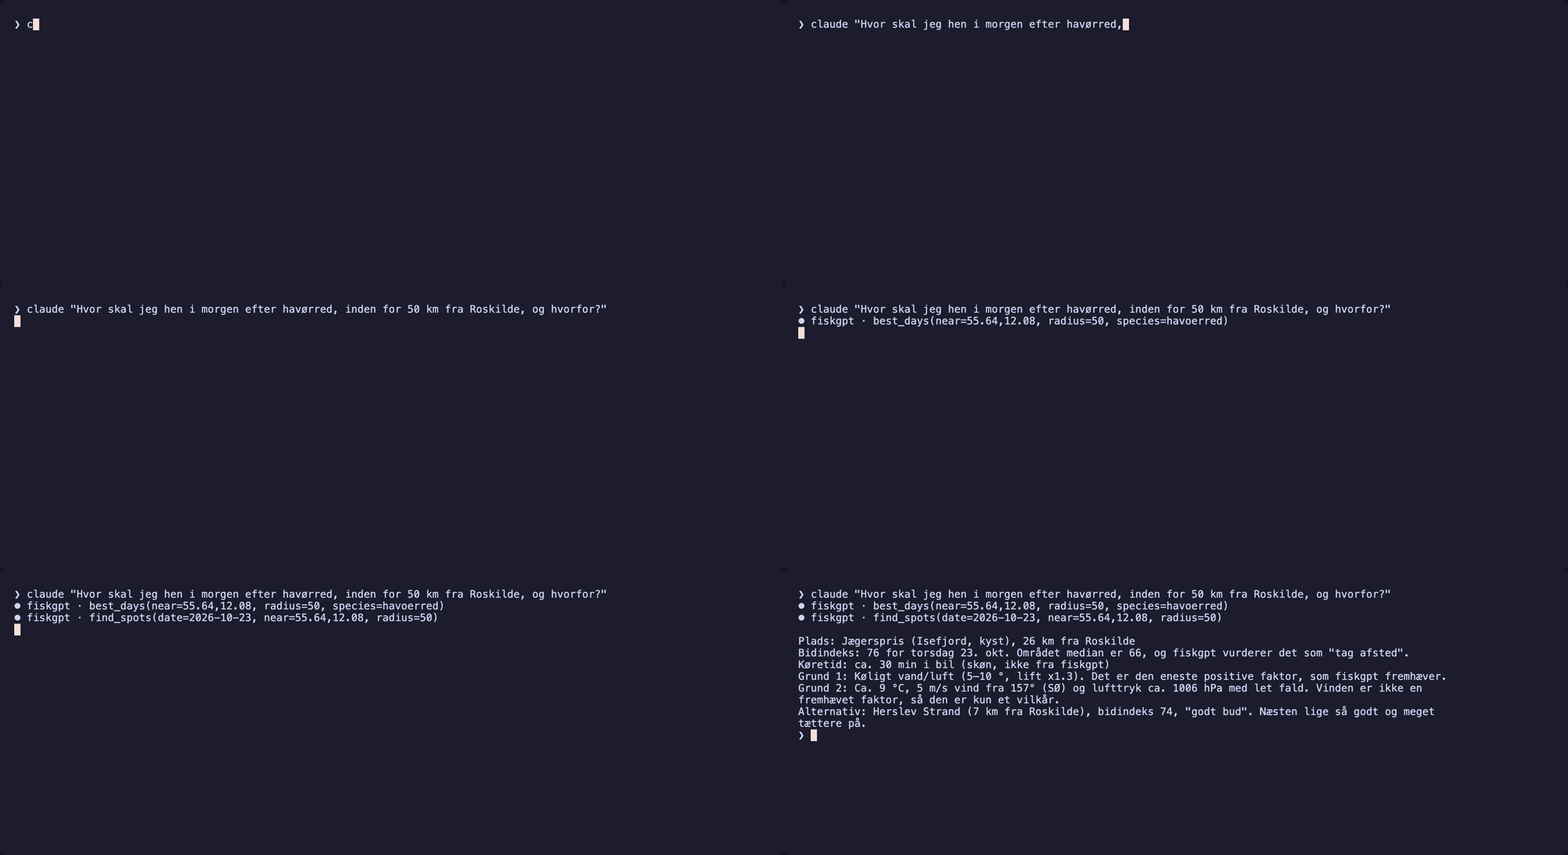
You can try it yourself in the terminal on the rightright below. The five questions are recordings of real calls, so they cost nothing. Type your own and Claude answers live: it calls the same tools against the same database the app uses, and you see every call, its arguments and the server's raw answer before the text arrives. The numbers are today's. The server scores all 1,380 spots every night.
If you run a catch log, a club site or an app with reports in it, I would really like to talk to you. The model gets better with every honest report, blanks included. Especially the blanks, in fact. Nobody has ever sent me one.
Now the claims go in the water [saturday]
It is November, which is an odd month to fish for sea trout. From 16 November to 15 January the coloured fish are protected in salt water, the ones in spawning dress heading up the streams. Hook one and it goes gently back, and better still you avoid them altogether. What you may keep are the silver fish over 40 centimetres that skipped spawning and stayed out in the fjord. The streams are closed until March, and around the stream mouths there are zones where you cannot fish at all. Bornholm and the Wadden Sea have their own rules on top. So a November trip is a trip for the few silver ones, with extra responsibility in your hands. But the weather fits: cold air, high pressure and not too much wind is exactly what the data says brings fish. So instead of ending with yet another chart, I asked the thing I had built the question it all started with. Roskilde Fjord north or south, Isefjorden, Nordkysten or Møn? Here's the answer for the coming Saturday, pulled the morning this went up:
Saturday 21 November. Westerly wind 5 m/s, gusts 14, and clear. 1006 hPa, up 9 in a day.
3 degrees. Days since the last proper blow: seven.

  Veddelev, Roskilde Fjord       bite index 86    + cold 0–5° (x1.7)  + light wind (x1.2)
                                                  − clear (x0.8)  − dry air (x0.8)
  Jægerspris, Roskilde Fjord     bite index 83    same weather, the coast faces another way
  Herslev Odde, Roskilde Fjord   bite index 83    same
  Grønsund Odde, Møn             bite index 100   + cold  + light wind, offshore
  Everything else on Møn         bite index 93 on average. The whole island is in play.
So the program says Møn, if I feel like driving an hour and a half for 14 points. Otherwise Veddelev, five minutes from home, early, with a small dark fly. And it says it with the calm you only have when you've never stood freezing in a pair of waders yourself. The timing, though, is my own fault: I finished this in November, two days after the closed season had begun. So Saturday stays a thought. I'll pick the thread up in mid-January, the day the closed season ends. As it happens, that is also my birthday, so I won't forget the date. Then I'll be standing at Veddelev when it gets light, outside the protection zones, and anything with colour goes back. If it turns into a blank, the model will just note that it was an 86 and not a 100, and that 14 percent of days looked better. So in that sense it has already learned what every angler knows: it is not always about catching something. The old hands call it patience and say nature is the prize. The model calls it an 86. It is probably the same thing.
Knæk og bræk. (it means good luck, roughly: break and crack)
Thanks to the four volunteers who have kept the club's site running since 2003, to DTU Aqua for Fangstjournalen, and to Meteostat and Open-Meteo for the weather. The fishing spots come from a catalogue that describes 1,380 Danish spots with coordinates and coast direction. None of them asked to be put in a database, and none of them get the blame for the result.
Written in Roskilde. Built with Python, scikit-learn, Postgres, Hono, Expo and Claude Code. This page is hand-written HTML with no framework, like the rest of the site. Questions, corrections and blanks: info@casperjuel.dk.